- Purpose: The Zain Indicator helps identify strong price direction based on support and resistance points.
- Features:
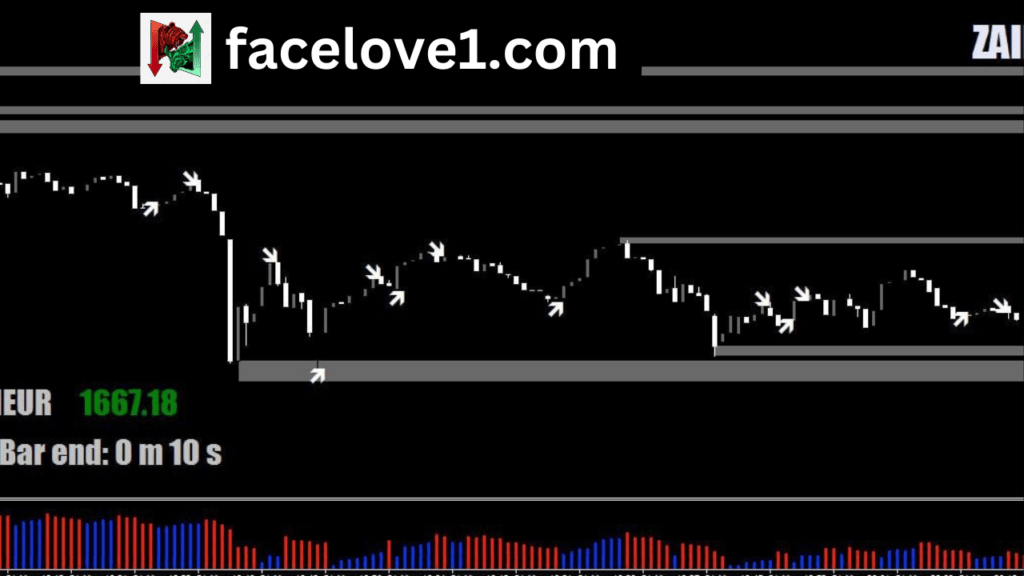
- Displays rectangles at probable support and resistance levels on the charts.
- Adds confirmation with arrows pointing in the direction of the trend.
- Includes a separate window below the charts with a histogram colored blue (bullish trend) and red (bearish trend).
- Strategy:
- Identify probable support and resistance zones on the chart.
- Look for rectangles drawn at these zones.
- Pay attention to the histogram colors (blue for bullish, red for bearish).
- Arrows appear only on live candles, not in historical data.
- Combine with other technical analysis tools and proper risk management strategies.
Remember that the Zain Indicator can be used alongside other indicators to strengthen trading decisions. If you’re interested in binary options or forex trading, consider exploring this powerful tool further! 📈🔍
ZAIN-V4